AWS alerts: know about outages before your customers do
Set up AWS alerts that reach you first. No alerts, alerts nobody sees, no dashboard: a small CloudWatch, SNS and Slack setup fixes all three, no new tool.
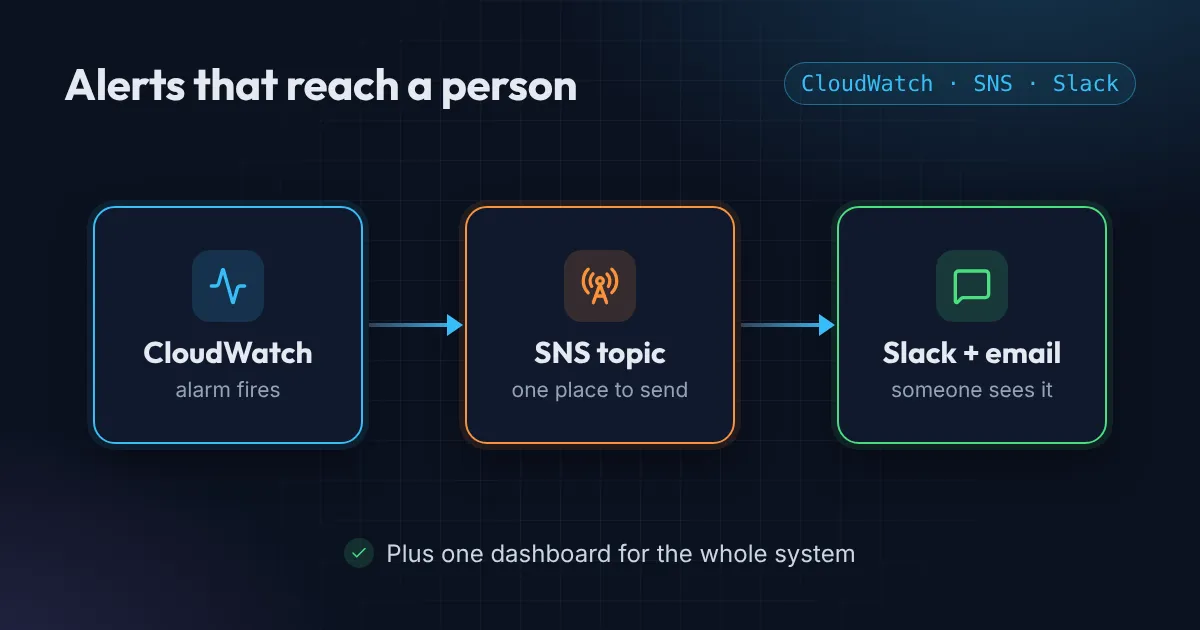
The worst way to learn your site is down is a message from a customer. The second worst is an AWS alert that fired six hours ago into an inbox nobody reads.
Good monitoring does not need an expensive platform. For most small teams, three gaps cause nearly every late discovery, and AWS already gives you the tools to close them.
Gap 1: No AWS alerts at all
If you have no alarms, the first alert is a customer. Start with the signals that mean users are being hurt right now:
- Server errors. A rise in 5XX responses means something is broken.
- Latency. Pages that suddenly take seconds instead of milliseconds.
- Capacity. CPU, memory, and disk running out.
Here is a CloudWatch alarm on 5XX errors from an Application Load Balancer:
resource "aws_cloudwatch_metric_alarm" "high_5xx" {
  alarm_name          = "api-high-5xx"
  namespace           = "AWS/ApplicationELB"
  metric_name         = "HTTPCode_Target_5XX_Count"
  dimensions          = { LoadBalancer = aws_lb.api.arn_suffix }
  statistic           = "Sum"
  period              = 60
  evaluation_periods  = 3
  threshold           = 5
  comparison_operator = "GreaterThanOrEqualToThreshold"
  treat_missing_data  = "notBreaching"
  alarm_actions       = [aws_sns_topic.alerts.arn]
}
Three one-minute periods means a single blip does not wake anyone up, but a real problem does. Tune the threshold to your normal traffic.
Gap 2: Alerts nobody sees
An alarm that emails a shared inbox is an alarm that gets ignored. The test of an alert is simple: does a human see it within minutes, in a place they already look?
Route alarms through an SNS topic, then send that topic to where your team actually works:
- Slack or Teams. AWS Chatbot, now part of Amazon Q Developer in chat applications, posts SNS messages into a channel with no code.
- An on-call tool for the urgent ones, such as PagerDuty. Only page for things that need a human right now. Everything else goes to a channel.
If everything pages, people mute everything. Split alarms into “wake me up” and “tell me tomorrow”, and keep the first list short.
Gap 3: No dashboard
During an incident, you do not want to explore logs. You want one screen that answers “what is wrong?” in ten seconds. For every service, put three things on a CloudWatch dashboard:
- Latency, using the p95 statistic, not the average. Averages hide the slow requests that real users feel.
- Error rate, as a percentage of requests.
- Traffic, in requests per second, so you can tell a traffic spike from a bug.
These three are often called the golden signals, and they are enough to tell you where to look next.
What it costs
A small setup like this is cheap. Standard CloudWatch alarms cost about ten cents each per month, and SNS notifications to email and chat are effectively free at low volume. Dashboards have a small monthly charge each, with a free allowance for the first few. A basic setup for one service runs well under a few dollars a month.
The checklist
- Alarms exist for errors, latency, and capacity.
- Alarms go through SNS to a channel people read.
- Only urgent alarms page someone.
- One dashboard per service shows latency p95, errors, and traffic.
- You have tested an alarm by triggering it on purpose.
I covered the idea in a 45-second Short. If you want your monitoring reviewed, my Free AWS Review includes a look at what would alert you today, or get in touch and I can set it up for you.
Want this set up for your team?
I build this kind of infrastructure for startups and small teams, with fixed prices and full handover.